I've been fooling around with OpenStreetmaps again, this time just trying out a couple of experiments that others did and hopefully in the process develop some interesting ideas to use the data.
I've blogged about Openstreetmaps
before. A couple of things have changed as Karmic came out. Some build steps require you to download more software and some packages may have been removed since then. I've had bigger problems getting mapnik to work, but that was related to the projection of the import of OSM into Postgis. When starting 'osm2pgsql', don't use the
"-l" flag, because that indicates conversion to latlong. The standard mapnik projection however is mercator. Most of the times, when nothing shows up in the rendered image, it's a projection problem somewhere. Just verify it all makes sense going backwards from the mapnik process and you should find it quick enough.
Anyway, a very interesting experiment I tried relates to hillshading. This is an effect where elevation data from different sources are merged (nowadays people use 'mashed') with map data in order to shade particular areas of the map to show where the hills are located. Elevation data for most of the world can be downloaded for free from the
Shuttle Radar Topography Mission. You should get
version 2.1. For the US, there's elevation data available with 30m horizontal accuracy, the rest of the world only gets 90m (or 3 arcseconds). Some tools exist to help you out in managing that data: srtm2osm (I didn't use this) or a script called
srtm_generate_hdr.sh (which I did use). Downloaded the data first, then produced the HDR files.
Then run a simple script:
cd /home/gt/srtm/
for X in *.hgt.zip
do
yes | /home/gt/srtm/srtm_generate_hdr.sh $X
done
This basically generates a number of TIF files for each particular region. These TIF files are height maps. When you look into them, you may be able to recognize certain parts of your country, but don't over-interpret the images you see, because the actual height doesn't really show up there.
In the Ubuntu repositories, there is a package called "python-gdal", which is a set of utilities in python to drive gdal utilities. This can easily be used to stitch the generated TIF files together to generate one huge height map for the entire region. I've used this to get a height map for the Benelux for example, resulting in a 55.0MB file.
Problem is that the projection is incorrect, so you need to assign the latlong projection first, then warp the image, reprojecting it to mercator (what mapnik uses) and in the process attempt to take out any invalid data points (set to 32767).
#> gdal_translate -of GTiff -co "TILED=YES" -a_srs "+proj=latlong" combined.tif combined_adapted.tif
#> gdalwarp -of GTiff -co "TILED=YES" -srcnodata 32767 -t_srs "+proj=merc +ellps=sphere +R=6378137 +a=6378137 +units=m" -rcs -order 3 -tr 30 30 -multi combined_adapted.tif warped.tif
Cool! So we now have a warped.tif in mercator projection that is basically an elevation map of the terrain. This is however not yet an image which uses the elevation data to 'shade' particular areas of the map. Think of putting the elevation data under a spotlight and then moving the spotlight to some particular origin (somewhere NW), located high above the map. This would create shady areas on the parts of the map where there are hills facing away from the lightsource. The other sides would be normally visible.
Perry Geo luckily did this work for me. You can download his utility here. I had to modify the Makefile to set the GDAL include path (-I/usr/include/gdal) and modify the included gdal library (gdal1.5.0). These tools create a 400-500MB hillshade file (18555x24128 pixels) if you use it for the entire Benelux region. That's still manageable, but in the process of getting there you may need 4GB of memory and a fast processor. The following image shows a minute detail of the Dutch coastline (scaled down 33%).
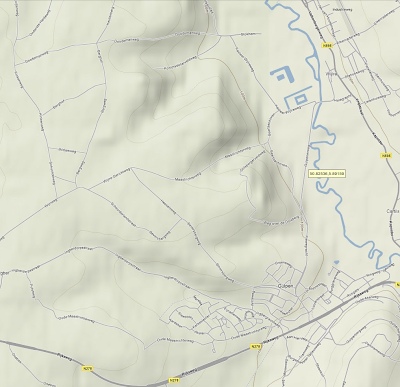
 So that's cool. This image can be used as a bottom layer for some mapnik generated tiles. If mapnik then paints other layers above it slightly translucent, the shading will slightly shine through the image, creating a sense of height throughout the map.
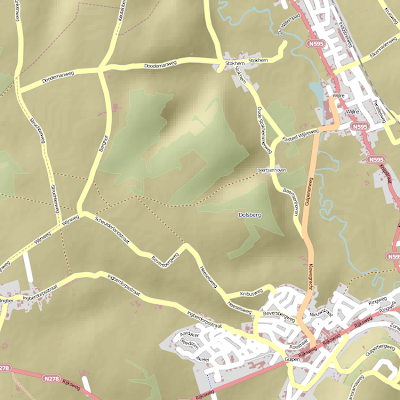
A standard mapnik image from a region in Belgium, close to Maastricht which has a number of hills looks like this:
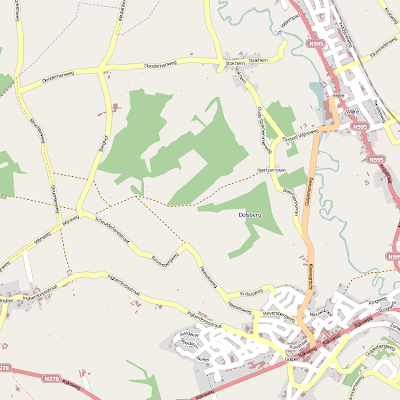
The same region in Google Maps, rendering terrain data, looks like this:
So, my rendered image looks different from Google's, but the styling wasn't optimized for terrain data in the mapnik renderer.
There's also a reason why the zoom level wasn't increased to about 18 or so. Remember that we downloaded the SRTM3 set, which provides 90m accuracy in the horizontal plane. The height map therefore interpolates between subplanes of equal elevation. This doesn't necessarily improve quality :). Google Maps doesn't go beyond zoomlevel 15, which is a reasonable one. Trying to render images at increased zoomlevels creates pixelated images that don't look nice at all. The height map can improve slightly with better algorithms, but no matter what you do, it will never be perfect. Google Maps even has a couple of areas with hills that look a bit blotchy, irregular or pixelated. The idea is just to get a sense of height of a mountain range anyway and drawing the contours around this map certainly helps to find out where the mountains are (especially for hiking and cycling maps, which use these techniques regularly).
Original sources with the tutorials are
here and
here.


 On the right is an image of a free flight simulator called FlightGear. It's used a lot for research purposes, but certainly also just to have fun and it is licensed under the GPL. You can fly anywhere in the world with the planes provided and the entire framework is reasonably extendable. There is actually a choice for the Flight Dynamics Model that you wish to use. Each FDM has different strengths and weaknesses. One focuses on airflow around the body parts and weight and another one more on the steering and so forth. The objective is realism and trying to simulate how things behave prior to real life development and tests. Thus, that cuts down on the costs of development significantly really. Its objective is not to compete with consumer-level flight simulator, nice flashy graphical details and so on, but the focus is on correctness of the flight model and other items around it.
 So that's cool. This image can be used as a bottom layer for some mapnik generated tiles. If mapnik then paints other layers above it slightly translucent, the shading will slightly shine through the image, creating a sense of height throughout the map.
 The same region in Google Maps, rendering terrain data, looks like this:
 So, my rendered image looks different from Google's, but the styling wasn't optimized for terrain data in the mapnik renderer.