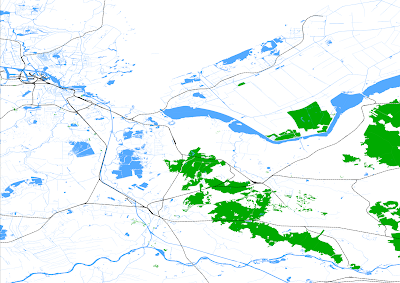
 In some previous project, I worked with GIS data to show demographic data on Google Maps. The underlying database is PostGreSQL. This post shows how you can use (part of) the database of OpenStreetMap (verify license!) to extract features from the dataset to paint this onto an SVG or PNG image. Using the PostGIS database in combination with the loaded data, you can extract features (these are like gmaps overlays, or GIS layers) and include them in the image. You want to include railroads and regular roads? Not a problem! You only want to include waterways and the general shape of the country? Can do! The image above was constructed by taking water, waterways, train railroads and forest areas of Holland. Then I zoomed in a bit to show the level of detail.
Since I mostly use Ubuntu, I'll explain the steps used to get things done.
Prerequisites:
- Postgres 8.3 + Postgres 8.3 server-dev package
- Postgis
- cmake
- qmake
- libqt4-dev
- bz2-dev library
- geos library
- gdal libraries (libgdal, gdal binaries *and* libgdal1-dev)
- libxml2-dev header files and library
- Benelux or other data: ( http://planet.openstreetmap.nl/ ) (no need to unpack! 170M packed, 1.8G unpacked )
svn co http://svn.openstreetmap.org/applications/utils/export/osm2pgsql/
Then, make and make install. This probably doesn't copy the default.style across from the svn checkout directory to where it is expected. So:
# mkdir /usr/share/osm2pgsql
# cp default.style /usr/share/osm2pgsql
Now, you're ready to load the Benelux data:
osm2pgsql --slim -c -l -dplanet-benelux-latest.osm.gz
Ok, so let's start visualizing this for a bit. You'll want to get qgis, compile that, install it, run it and then connect to your database:
# svn co https://svn.osgeo.org/qgis/branches/Release-1_1_0 qgis_1.1.0
# cd qgis-1.1.0
# mkdir build
# cd build
# ccmake ..
(verify output, resolve errors). Press 'g' to generate scripts
Then you should be able to run qgis from the command line: qgis. This starts up the application. If you look for a couple of ESRI shape files, you can load them up and play around with them to see how things work. For the open street map data we have downloaded, we can connect to the database using "Add Postgis Layer". This allows you to select the host, database and tables to load in. It takes a while to get data out of the database, but eventually you get there and it shows all of the Benelux in a particularly bad colorful display :).
A better way to get your data out is by using multiple layers, instead of one. There are a set of utilities that can be useful to load ESRI shapes into the database, but also to get them out. Since we can use where statements, disjunctions and conjunctions in SQL, it is simple to pick out what you're looking for, put this into a shape file and load it into qgis for visualization. Note that the polygons are great for showing a bit of volume and color and that lines are more useful for borders:
pgsql2shp -f forests"select osm_id, landuse, "name", way from planet_osm_polygon where landuse='forest'"
pgsql2shp -f water"select name, way from planet_osm_polygon where \"natural\"='water'"
pgsql2shp -f waterwegen"select name, way from planet_osm_polygon where not waterway is null"
pgsql2shp -f railways"select name, way from planet_osm_line where railway = 'rail'"
These exported shape files can now be imported into QGis. Then adjust the properties per layer, specifying pen for drawing a black line around polygon areas or not (I didn't in this case). The lines only use a pen and don't have fill colors. Match wood / forest areas with green and water with blue, then select particular types for roads and railways and you're set!
Using the Print Composer function in QGis, you can now export what you've been creating. Make sure to use the Add Map button first, then export to either SVG (Inkscape?) or PNG.
Here's a page that explains the features in the database, but note that the features are not consistently used throughout the database, so you should always check your results:
http://wiki.openstreetmap.org/wiki/Map_Features
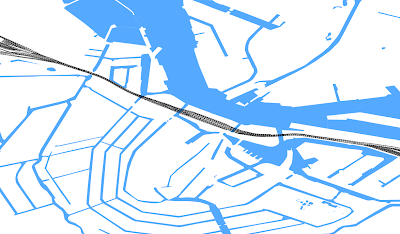
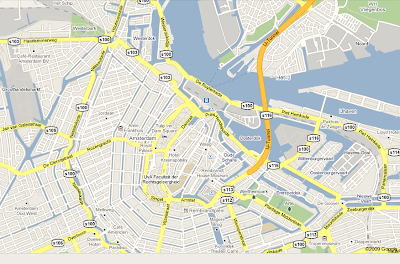
More detailed zoom-in near Amsterdam area using the same restricted set of layers and a comparison with Google Maps:

 Notice how Google maps have painted areas in a more generalized way, whereas the openstreetmap image is still the original ESRI format. It should not be very difficult to start painting images of GIS data in a format like the Google one above, then overlay the original high-resolution data over those images to indicate the position of cafés, cinema's, etc...
Good luck!


No comments:
Post a Comment